
Why fewer Finnish trains arrived on time in June
Long-distance punctuality fell to 84% in June. We unpack the metric, the causes assigned by railway data and what the number does not tell passengers.
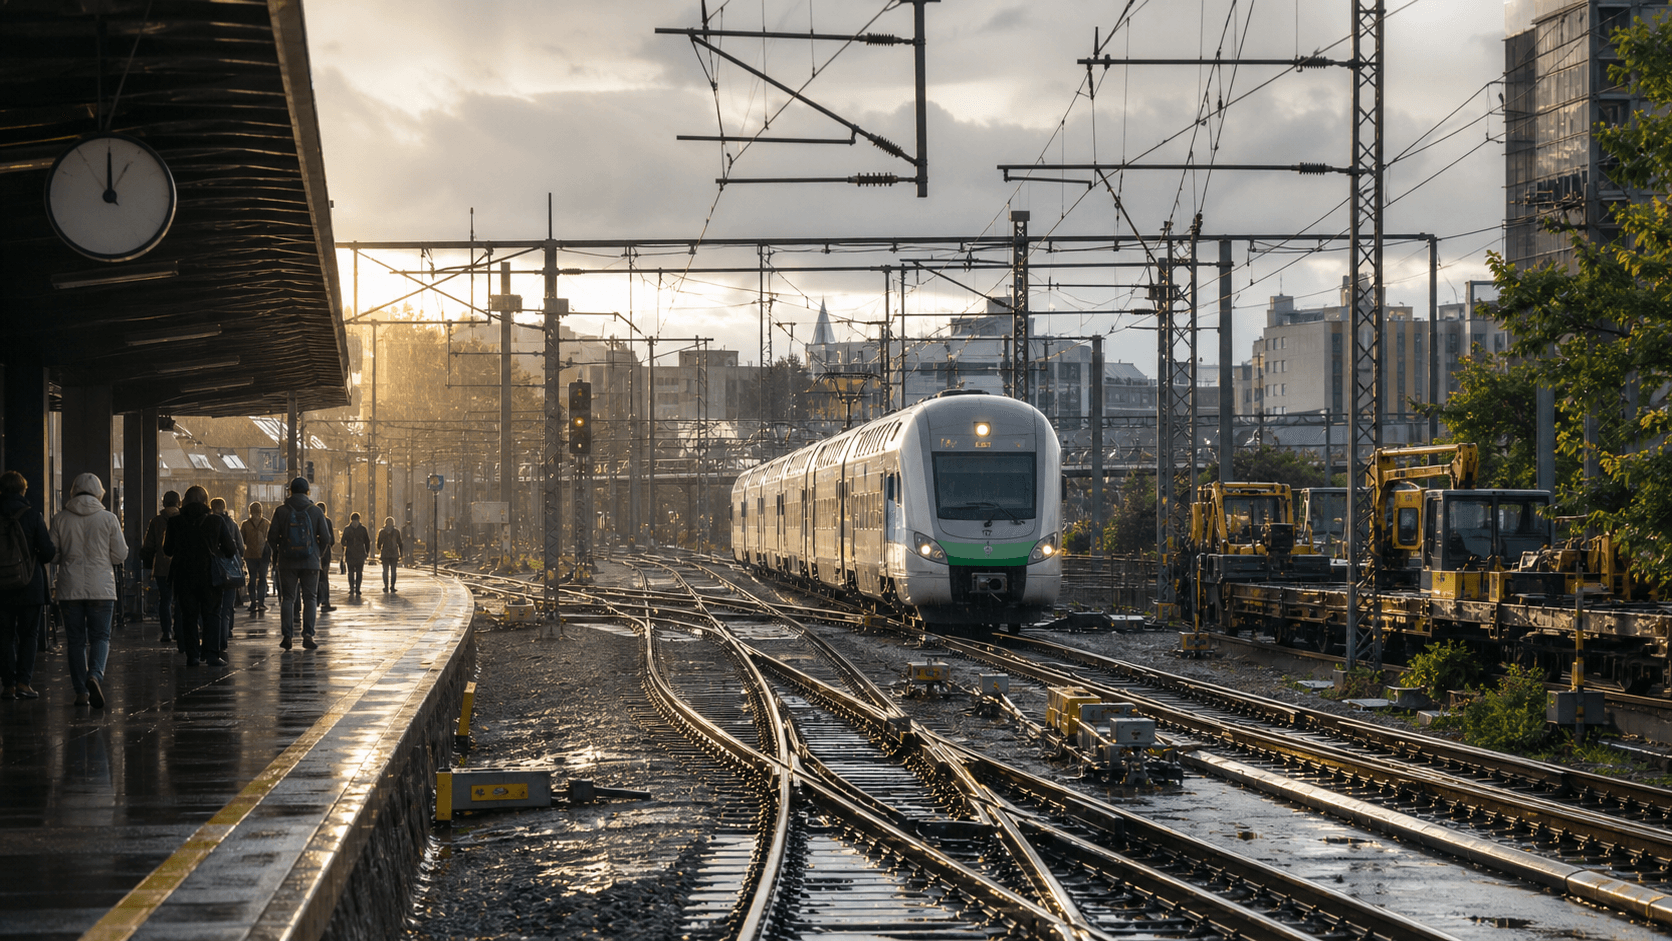
One number can describe thousands of journeys
In June 2026, 84% of Finland's long-distance trains reached their destination no more than five minutes late. Purchased commuter services recorded 93% within three minutes.
Both figures sound precise, but they compress an entire railway month into one percentage. To understand what passengers experienced, we need to know the threshold, the traffic type and the causes recorded behind the delays.
What punctuality actually measures
For long-distance trains, VR reports the share arriving within five minutes of schedule. A train that arrives six minutes late counts outside the target, just like one that arrives much later. The percentage therefore tells us how often the service met a defined threshold—not how severe every delay was.
Purchased commuter traffic uses a tighter three-minute threshold. That makes a direct comparison imperfect: 93% commuter punctuality and 84% long-distance punctuality are based on different service patterns and different limits.
Where the recorded delays came from
VR attributes 63% of long-distance delay minutes or cases in June to railway infrastructure, 16% to VR and 20% to other causes. The published figures are rounded, so they do not necessarily add to exactly 100%.
For purchased commuter services, infrastructure accounted for 55%, other causes 35% and VR 10%. Infrastructure is a broad operational category: track faults, signalling problems, capacity constraints and work on the railway can all affect trains. “Other” can include events outside the operator's direct control. The categories allocate responsibility in reporting; they do not describe every passenger's individual disruption.
Why summer work appears in the statistics
Finland concentrates large railway projects into the warmer months. Work that improves future capacity can temporarily reduce current capacity, alter platform use or force trains through slower and more complex operating arrangements. The paradox is real: construction intended to make the railway more reliable can make one summer less punctual.
That does not mean every June delay came from planned work, and the published monthly table cannot prove one single cause. It does show that infrastructure was the largest attributed category.
Passenger volume gives useful context
Long-distance trains carried about 1.4 million journeys in June, and their load factor was 50%. A percentage-point change therefore represents many individual arrivals. It also means the passenger impact depends on which trains were late: a disruption to one heavily used service can affect more people than several quieter delays.
How to use the number
Punctuality statistics are best for seeing a system trend, not predicting tonight's train. For a current journey, check the live train status, platform and connections. For policy and infrastructure, follow the monthly series over time instead of judging the railway from one difficult day.
VR notes that its reporting convention changed in 2026 and that earlier figures were updated for comparability. That is good statistical practice, but it means readers should use the current series rather than combining screenshots from differently defined reports.
Sources and last checked
The June percentages, attributed causes, journey volume and reporting note come from VR Group's rail traffic indicators. Information was checked on 13 August 2026. The article explains the published categories and does not infer causes beyond the source data.